Ein ganz schönes Durcheinander / Un bel casino
Mapping politics and other topics
Free University of Bozen-Bolzano
Project C1SE10, spring semester 2010
Project leader Kris Krois
The course was an introduction to information design and data visualization; the students designed maps, charts and statistical graphics to communicate different topics. For the final artefact the students worked with journalists to recover data and designed infographic posters about Italian politics.
Our goal was to communicate information clearly and effectively through graphical means. To reach this, «[…] to convey ideas effectively, both aesthetic form and functionality need to go hand in hand, providing insights into a complex data set by communicating its key-aspects in a more intuitive way.» (Friedman 2008)
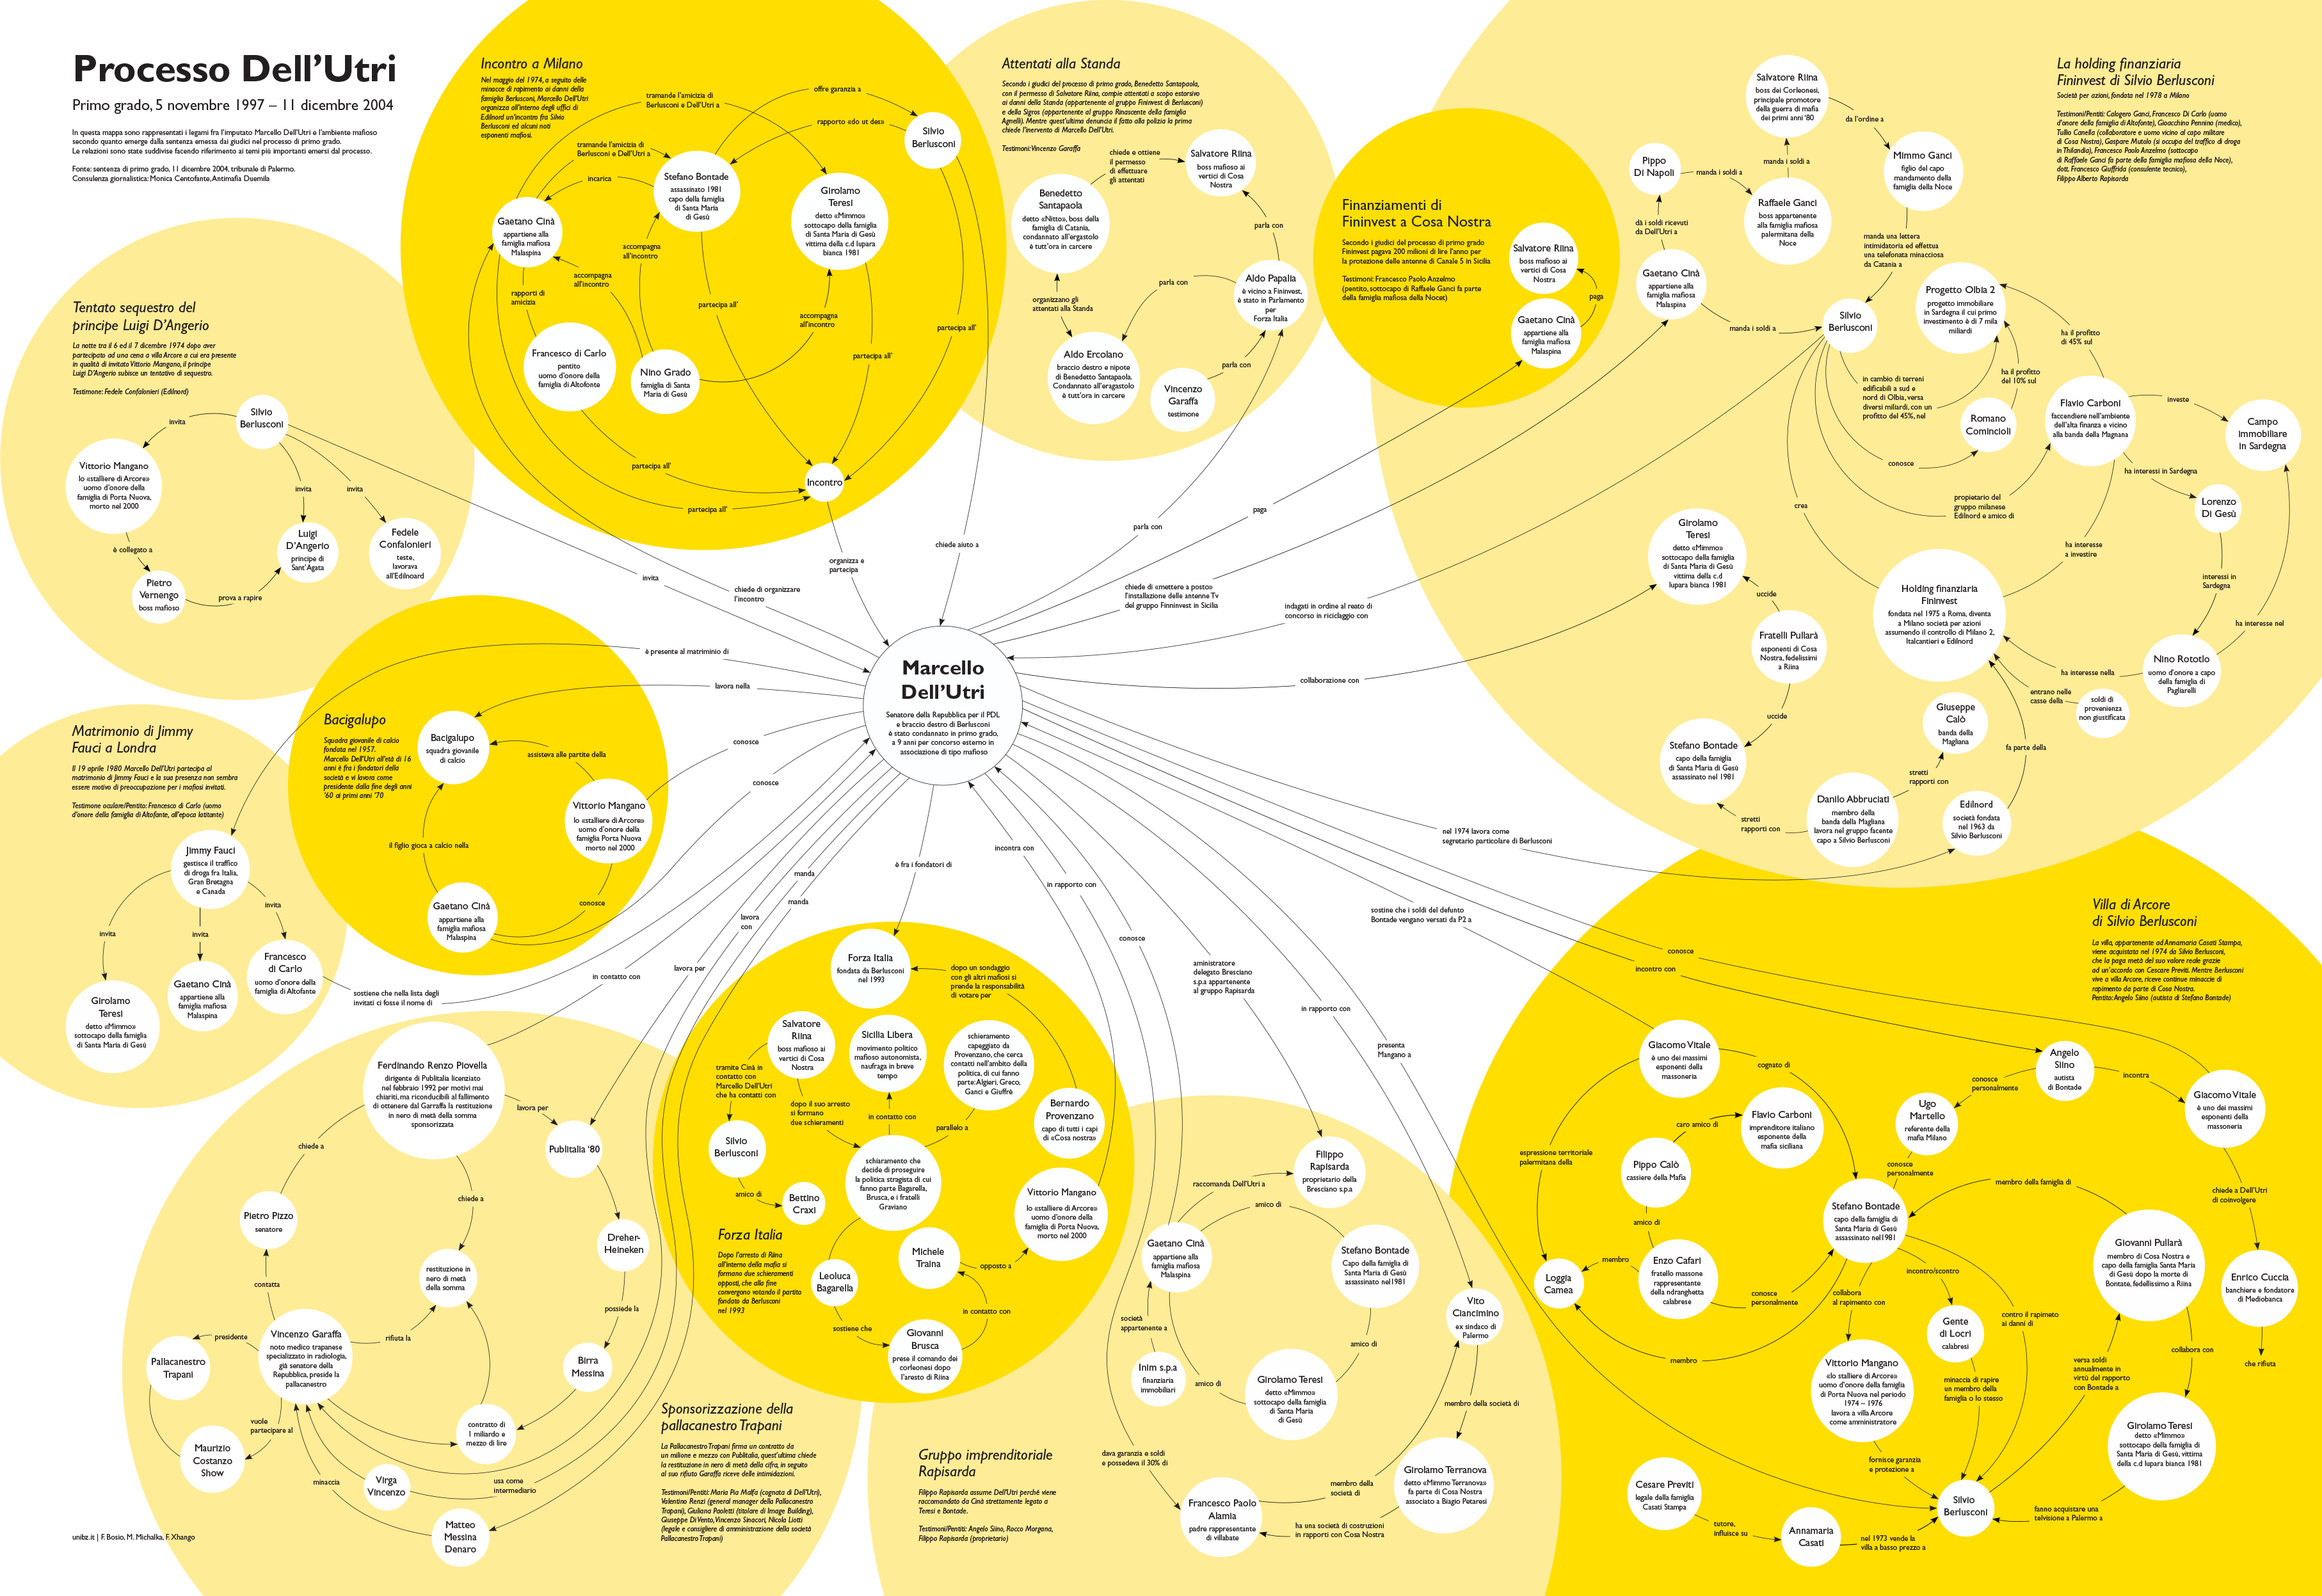 Francesca Bosio, Magdalena Michalka, Flavia Xhango. Mapping Politics, cm 65 x 45.
This chart reveals the links between the Italian politician Marcello Dell'Utri and the Mafia environment that came to light in the sentence of the court of first instance (1997–2004). Hi resolution
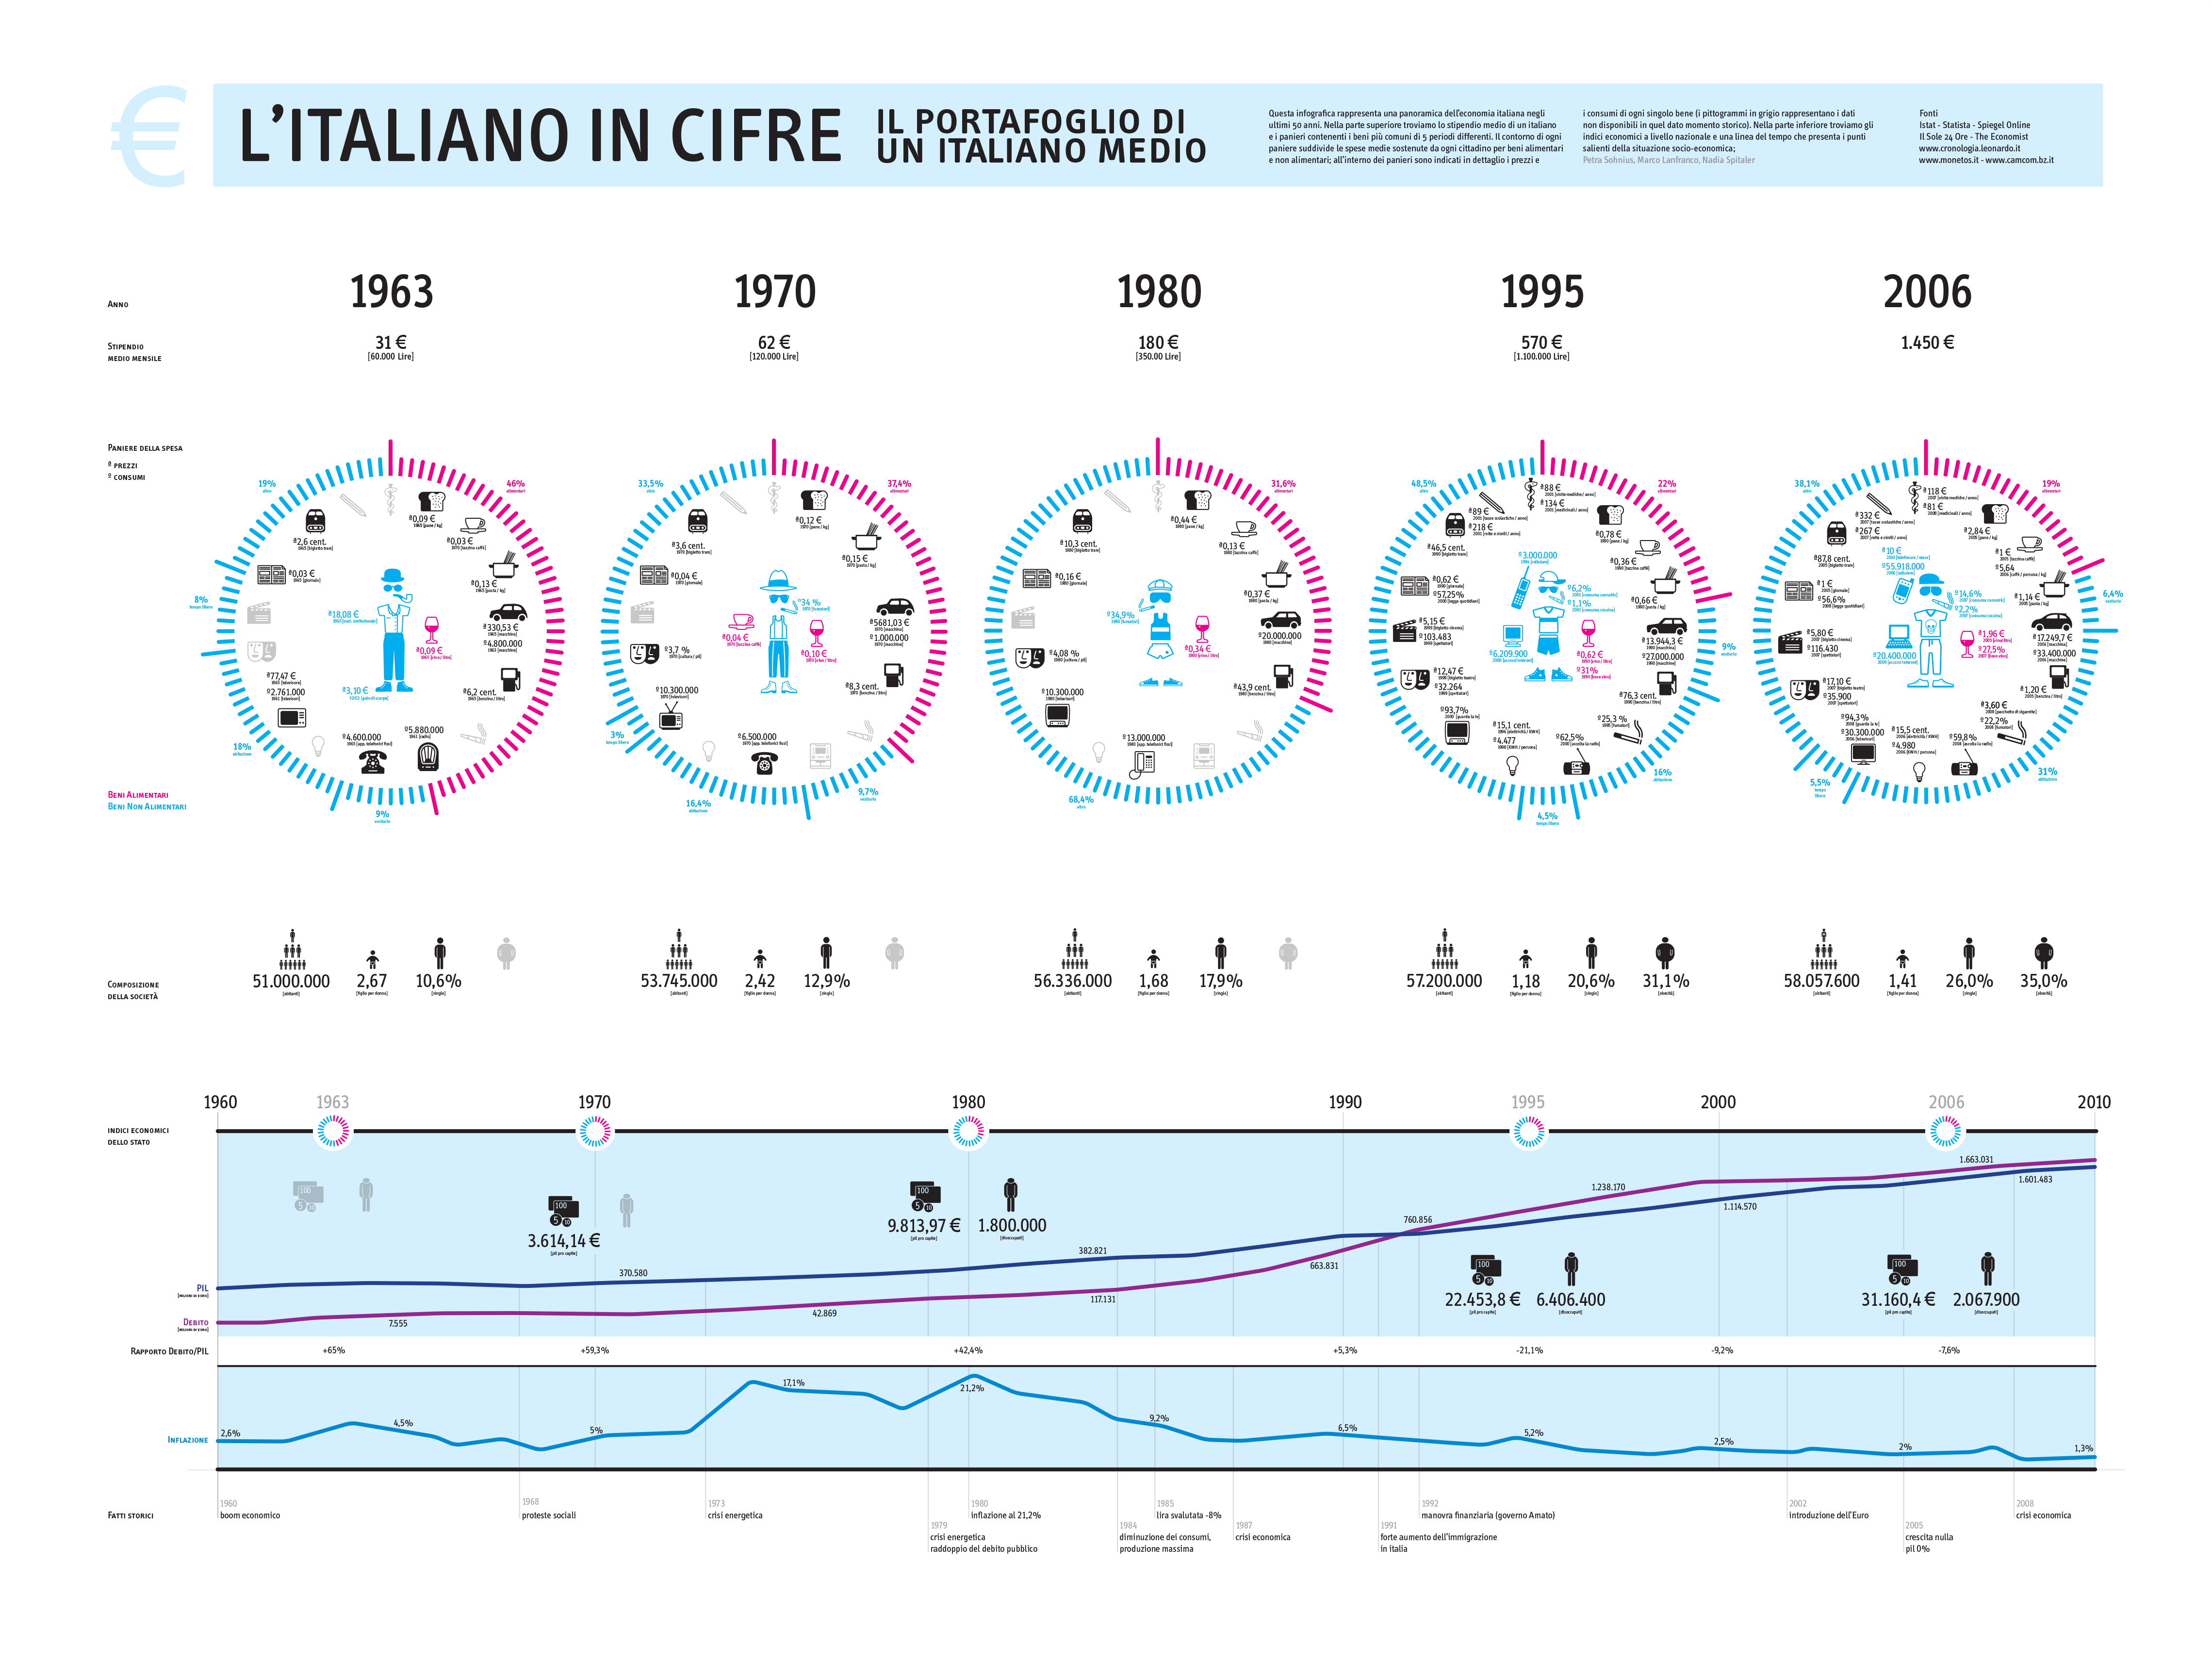 Marco Lanfranco, Petra Sohnius, Nadia Spitaler. Mapping Economics, cm 80 x 60.
A visual overview of the Italian economy in the last 50 years. Hi resolution
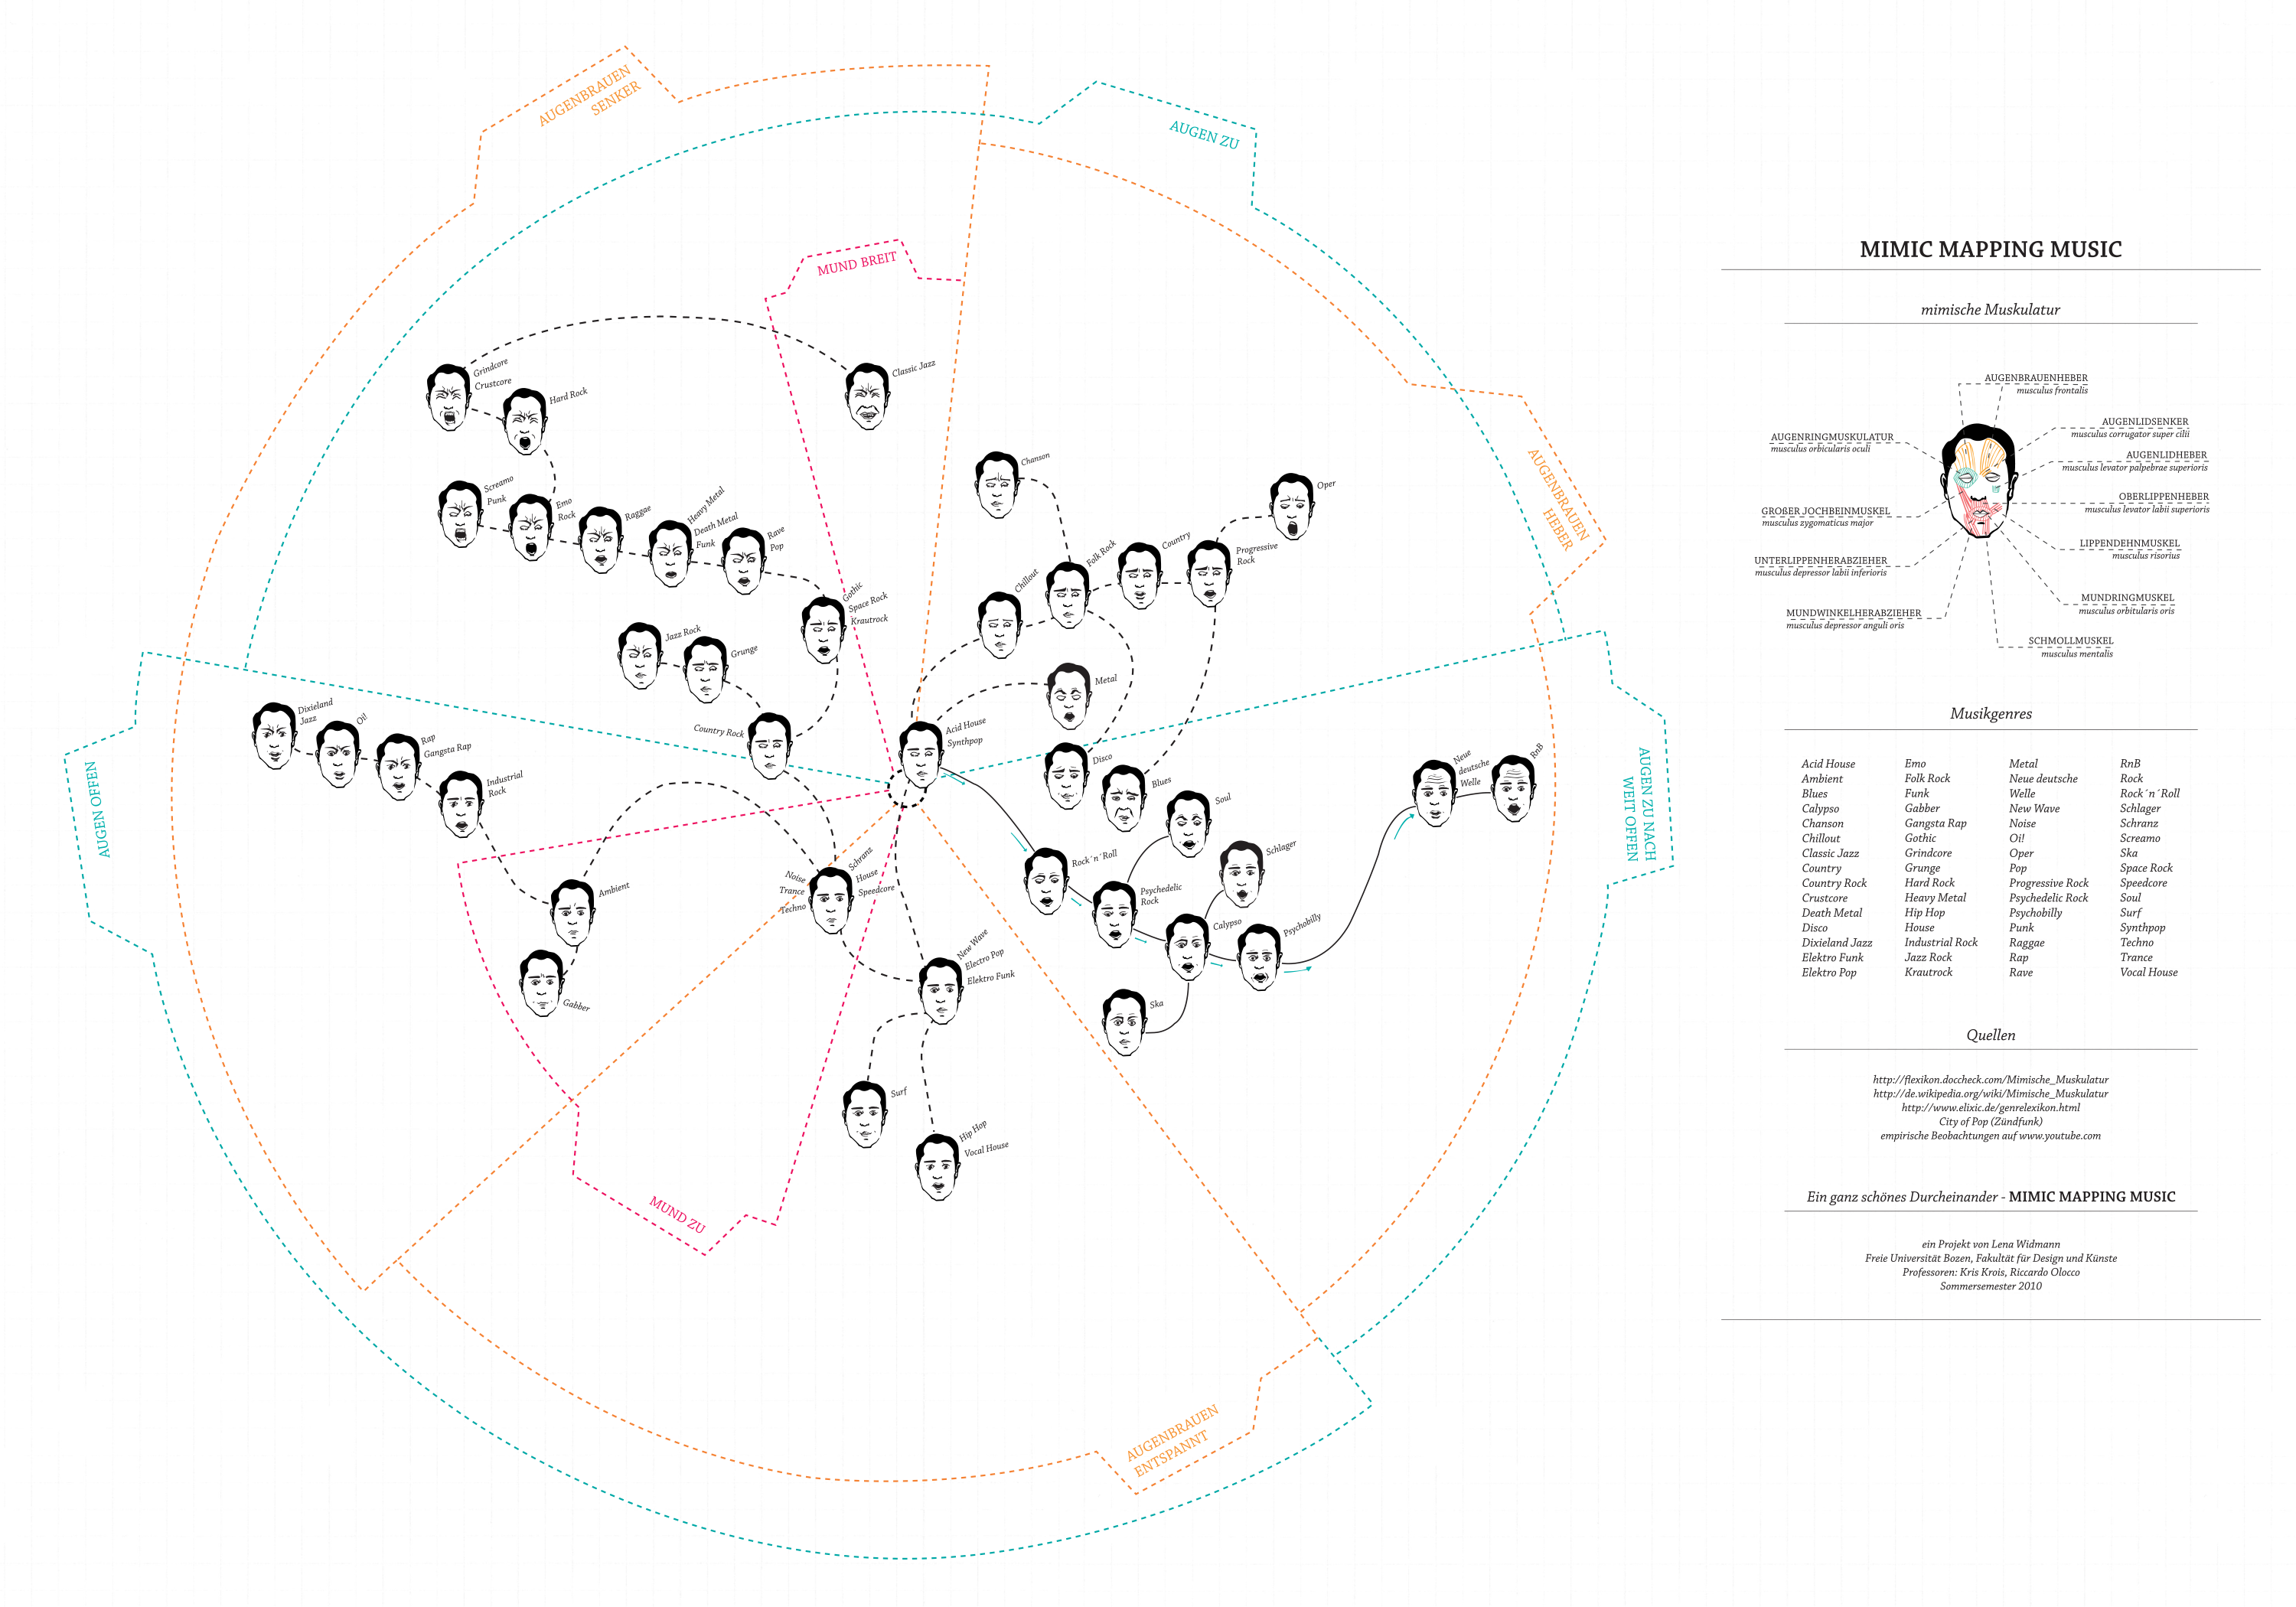 Lena Widmann, Mapping Music. cm 100 x 70.
This chart classifies the pop musical genres through the analysis of the singers facial muscles. Hi resolution
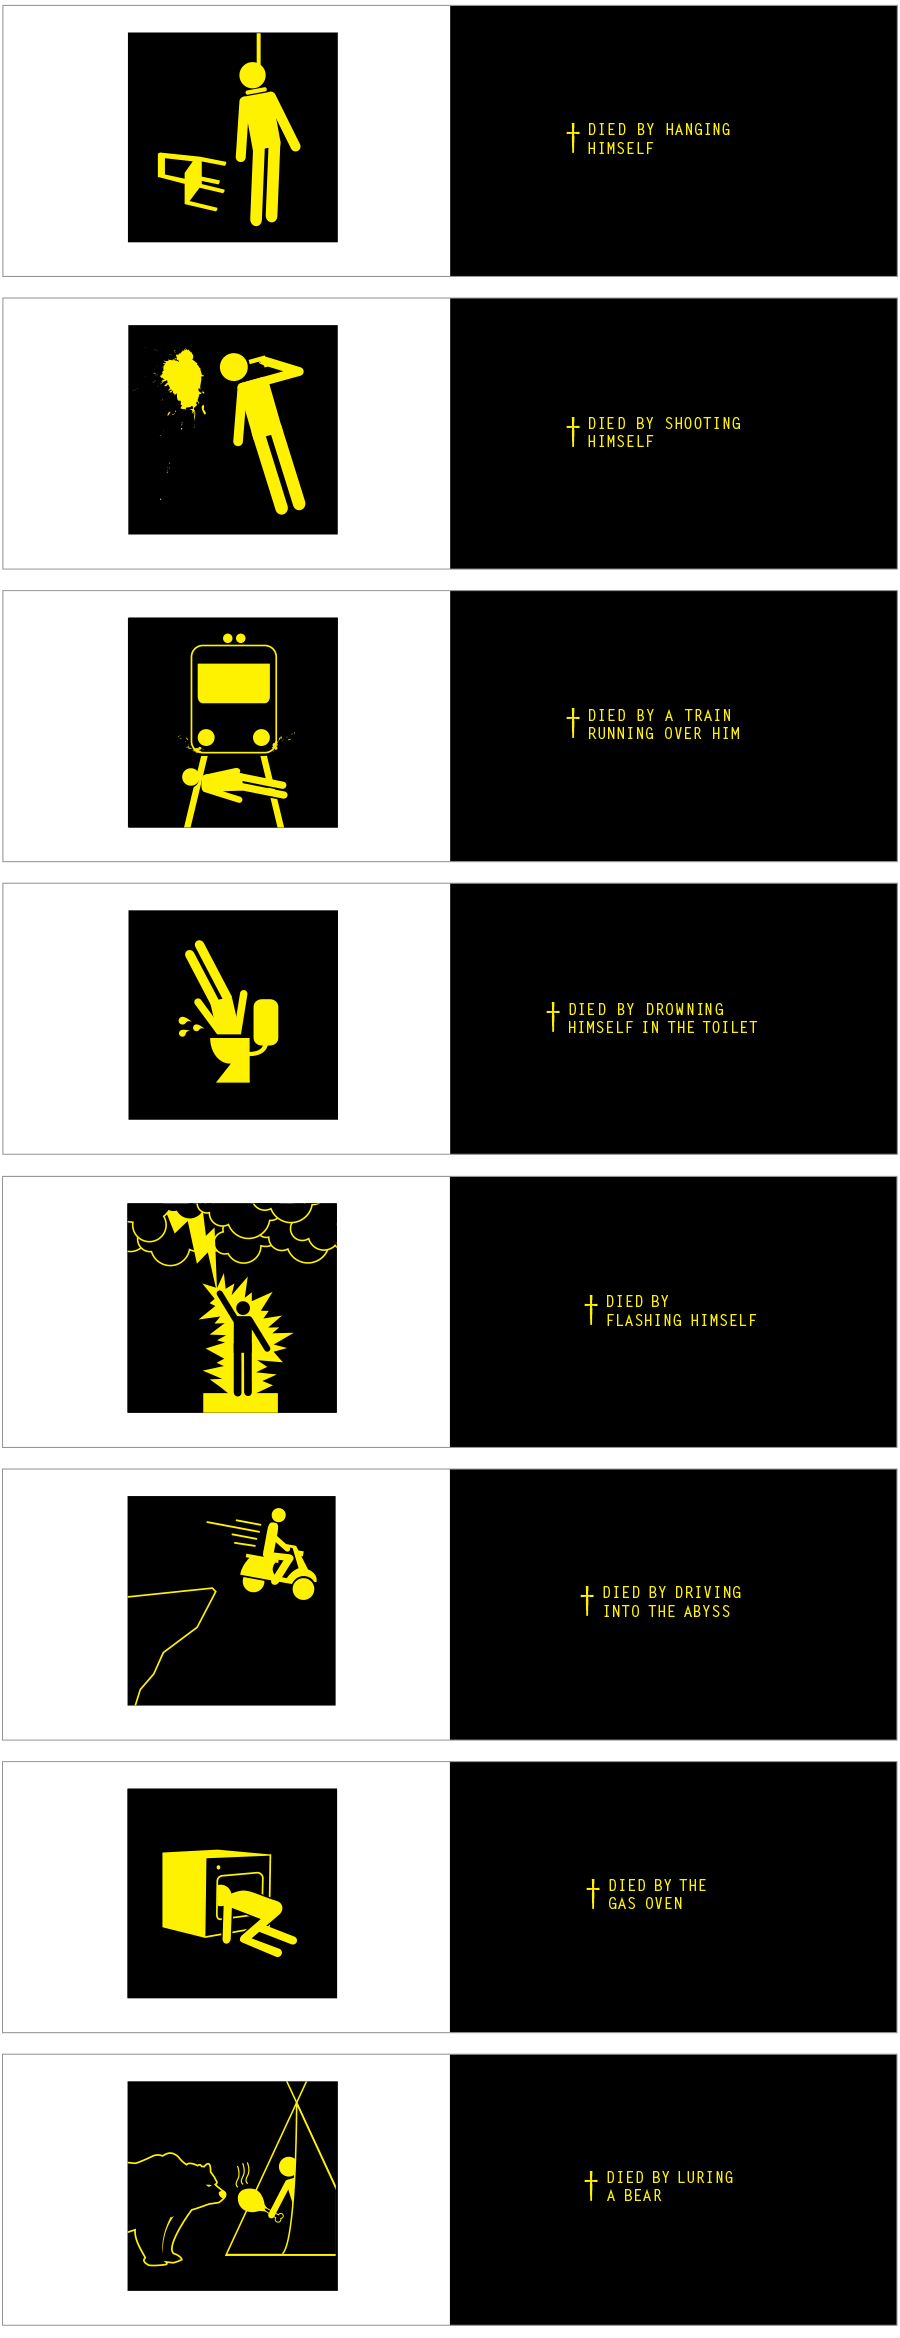 Maximilian Tora, Suicide Pictograms. cm 16 x 10